Routesonline analyses the African aviation industry, taking a monthly look at the top routes served and revealing the airlines that are dominating the market. We also rank the top ten airports by available seat capacity and examine the most common aircraft used.
All data provided by OAG
Top African airline routes
Domestic routes in South Africa ranked at number one and two in July 2017, with Johannesburg O.r. Tambo International (JNB) to Cape Town (CPT) having the most available seats. The route is served by seven carriers, with South African Airways having the most available capacity.
https://infogram.com/africa_routes_july_2017
Top African airlines
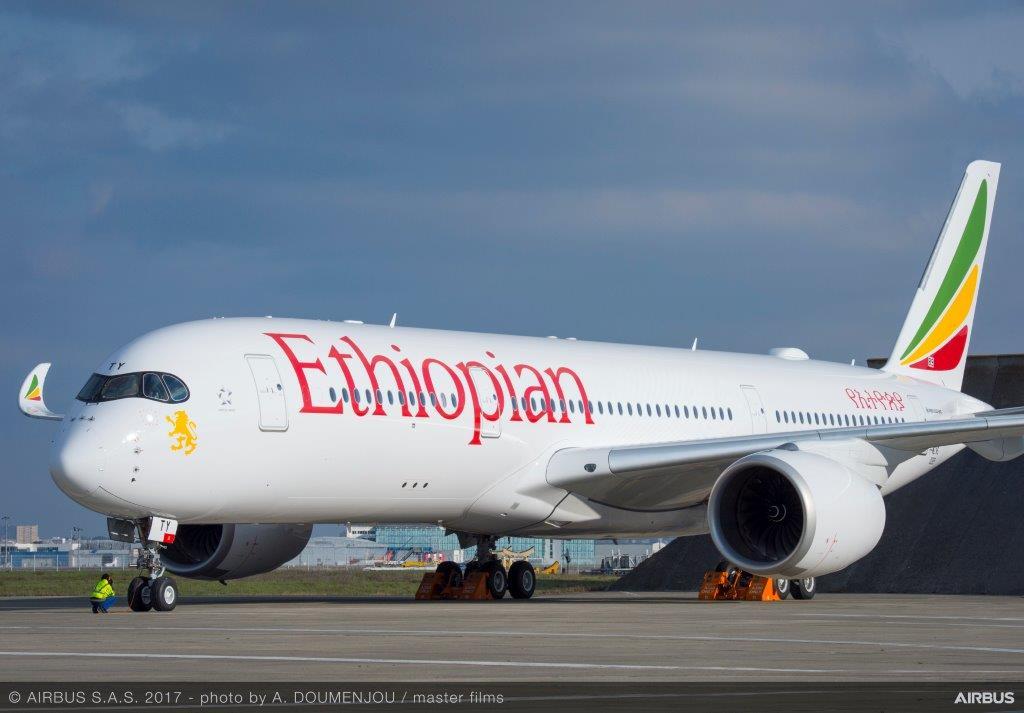
Ethiopian Airlines topped the table for July 2017 with 1,124,252 available seats, up by 6.6 percent compared with June. Royal Air Maroc was the biggest month-on-month climber in the top ten airlines list with 44.5 percent growth.
https://infogram.com/africa_airlines_july_2017
Top African airports
Casablanca Mohammed V enjoyed the largest capacity growth in July 2017, up 34.3 percent compared with a month earlier. The rise comes after Royal Air Maroc increased its services to New York JFK and Sao Paulo Guarulhos, while EgyptAir also upped the frequency of its Cairo route.
https://infogram.com/africa_airports_july_2017
Most-used aircraft
Boeing 737's capacity share in Africa during July 2017 was 42.4 percent. Ethiopian Airlines has 25 in its fleet while South African Airways has 73.
https://infogram.com/africa_top_aircraft_july_2017
The full African aviation industry data
Top routes (July 2017):
| Rank | Route | Jun-17 capacity | Jul-17 capacity | % capacity change |
| 1 | Johannesburg O.r. Tambo International (JNB) - Cape Town (CPT) | 488693 | 505396 | 3.4% |
| 2 | Johannesburg O.r. Tambo International (JNB) - Durban King Shaka International | 334549 | 336009 | 0.4% |
| 3 | Jeddah (JED) - Cairo International (CAI) | 350720 | 293382 | -16.3% |
| 4 | Lagos (LOS) - Abuja (ABV) | 154912 | 160440 | 3.6% |
| 5 | Cairo International (CAI) - Riyadh King Khalid Intl (RUH) | 126468 | 152278 | 20.4% |
| 6 | Johannesburg Lanseria International (HLA) - Cape Town (CPT) | 136726 | 142292 | 4.1% |
| 7 | Kuwait (KWI) - Cairo International (CAI) | 124666 | 136521 | 9.5% |
| 8 | Durban King Shaka International (DUR) - Cape Town (CPT) | 120697 | 123448 | 2.3% |
| 9 | Algiers (ALG) - Paris Charles de Gaulle (CDG) | 83832 | 119964 | 43.1% |
| 10 | Port Elizabeth (PLZ) - Johannesburg O.r. Tambo International (JNB) | 110501 | 118358 | 7.1% |
Top airlines (July 2017):
| Rank | Airline | Jun-17 capacity | Jul-17 capacity | % monthly change |
| 1 | Ethiopian Airlines | 1055124 | 1124252 | 6.6% |
| 2 | South African Airways | 1050900 | 1086795 | 3.4% |
| 3 | Royal Air Maroc | 546533 | 789594 | 44.5% |
| 4 | Egyptair | 683413 | 699413 | 2.3% |
| 5 | Air Algerie | 630640 | 690458 | 9.5% |
| 6 | Kenya Airways | 468571 | 489361 | 4.4% |
| 7 | British Airways | 367261 | 373668 | 1.7% |
| 8 | Emirates | 356724 | 373056 | 4.6% |
| 9 | Comair | 336420 | 342468 | 1.8% |
| 10 | Air France | 282873 | 327089 | 15.6% |
Top airports (July 2017):
| Rank | Airport | Jun-17 capacity | Jul-17 capacity | % monthly change |
| 1 | Johannesburg O.r. Tambo Int | 1188790 | 1234068 | 3.8% |
| 2 | Cairo International | 1073938 | 1103600 | 2.8% |
| 3 | Casablanca Mohammed V | 484289 | 650531 | 34.3% |
| 4 | Addis Ababa | 607746 | 642734 | 5.8% |
| 5 | Algiers | 503208 | 561899 | 11.7% |
| 6 | Cape Town | 527389 | 550099 | 4.3% |
| 7 | Nairobi Jomo Kenyatta International | 441438 | 474107 | 7.4% |
| 8 | Tunis | 307548 | 372594 | 21.1% |
| 9 | Lagos | 357080 | 370662 | 3.8% |
| 10 | Durban King Shaka International | 306971 | 311535 | 1.5% |
