
Latest Commercial Aviation Content by Aviation Week & Space Technology
Jul 01, 2013
Changes have been made to methodology and categories, and prior year results have been restated to reflect this. Scores represent the composite of six performance categories. The categories and their contributions to total score are: Liquidity (15%), scored from metrics measuring cash and equivalents; implicit borrowing capacity computed from a percentage estimate of unencumbered asset collateral to debt; and unrestricted cash reserves per available seat-mile.

Jul 01, 2013
Testing of second 900EP marks next phase for family's enhancement

Jul 01, 2013
Smaller carriers dominate highest spots in overall rankings for Top-Performing Airlines index.
Jul 01, 2013
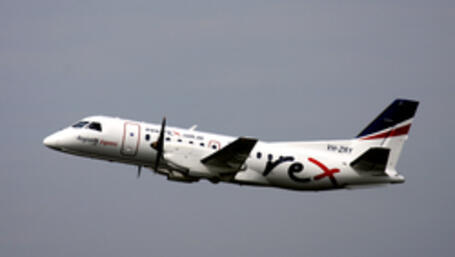
Rank: 2nd, revenues of $250 million-$2 billion Sales (12 months through Dec. 2012): $275 million
Jul 01, 2013
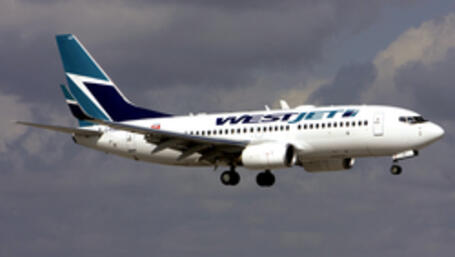
Rank: 2nd, revenues of $2-6 billion 2012 sales: $3.4 billion

Jul 01, 2013
Along with fleet changes, Air New Zealand is rolling out a new livery.
Jul 01, 2013
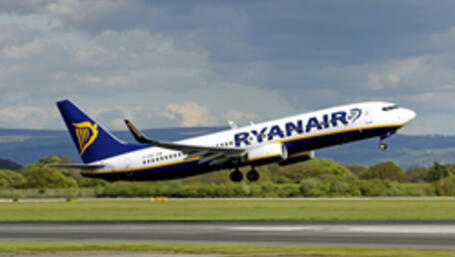
Airline rankings reveal conflicting trends in early stages of rebound

Jul 01, 2013
$450,000 and 80—the amount the Experimental Aircraft Association will pay—under protest—to FAA to cover the expenses of the four-score additional controllers and supervisors required to manage traffic at the July 29-Aug. 4 AirVenture gathering in Oshkosh, Wis., during which 8,000-10,000 aircraft are expected to alight and depart. This is the first time the agency has charged for the service.